This piece respectfully responds to Mr. Robin Brooks' recent comments about the hype concerning China's green transition.
Robin Brooks is a senior fellow in the Global Economy and Development program at the Brookings Institution. His research focuses on global growth and inflation dynamics, capital flows to emerging and frontier markets, as well as Western sanctions policy and the G7 oil price cap on Russia.
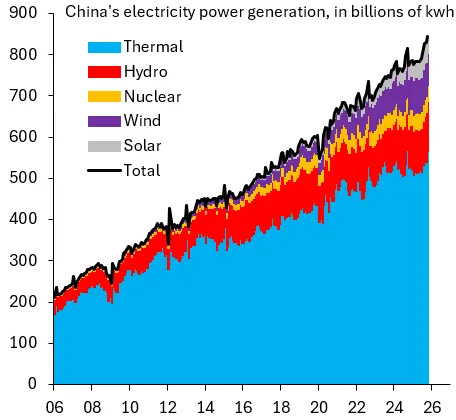
One thing I'll regret about 2025 is how many nonsense meetings I had to sit through on how China is becoming the world's "green" super power. Two-thirds of electricity generation in China is from thermal power plants (blue). That's coal. Give me a break...
He linked to his Dec. 7, 2025 article, titled "China's Electrification Mirage," in which he said:
….There's no doubt that China in recent years built impressive transmission infrastructure, but what matters at the end of the day is power generation, which still overwhelmingly comes from fossil fuels. All the power lines in the world don't make you sustainable or energy independent if you're still having to import and burn tons of fossil fuels. To my mind, the hype far exceeds reality where China electrification is concerned.
Mr. Brooks presented the chart above and added:
It's true that solar and wind are growing in importance, but let's keep things in perspective. Their shares in total electricity generation were five and nine percent, respectively, in October 2025 versus 67 percent from thermal power. Maybe China is electrifying, but what matters is where this power comes from and that's still overwhelmingly from fossil fuels.
He further noted:
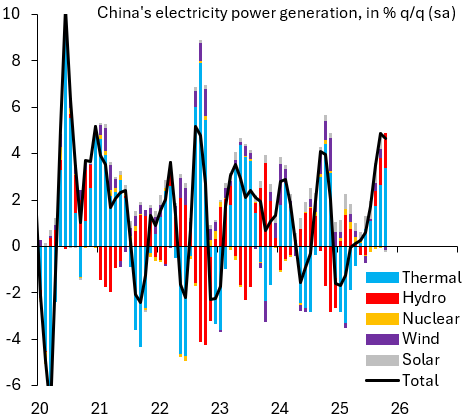
There does look to be a ramp up in electricity generation in the last few months of data, but even that is mostly from thermal power plans and not wind or solar. The chart above shows the growth contributions of various power sources on a quarter-over-quarter basis. Much of the ramp up in electricity production is due to thermal and isn't based on renewable energy. I don’t mean to diminish the extensive build out of China's transmission infrastructure. But - in the end - what matters is where the electricity comes from and it’s from the same old fossil fuels as before.
Mr. David Fishman has offered a detailed response to Mr. Brooks' comment. Mr. Fishman works at the Lantau Group, specializing in China's power sector. His work spans solar, wind, coal, nuclear, hydro, transmission, and power markets, with a particular focus on renewable energy policies and market forecasting. He holds a joint MA in International Relations and Energy Policy from Johns Hopkins SAIS and Nanjing University, and is fluent in Mandarin.
With his permission, I am sharing an adapted version of his response below, in the hope of contributing to a more comprehensive and balanced debate. Please note this is not a word-for-word quotation. I have slightly edited the wording and formatting for clarity.
Thanks for reading Yuzhe He's newsletter! I devote my free time to extensively reading China-related materials so you don't have to. Feel free to share it with your friends, colleagues, students, and anyone else who might benefit!
A more careful way to read the data on China's power mix
1. The premise is flawed
If we must go about assigning a label like "green superpower," then it's too narrow to define "green superpower" by what percentage of a country's power comes from renewables.
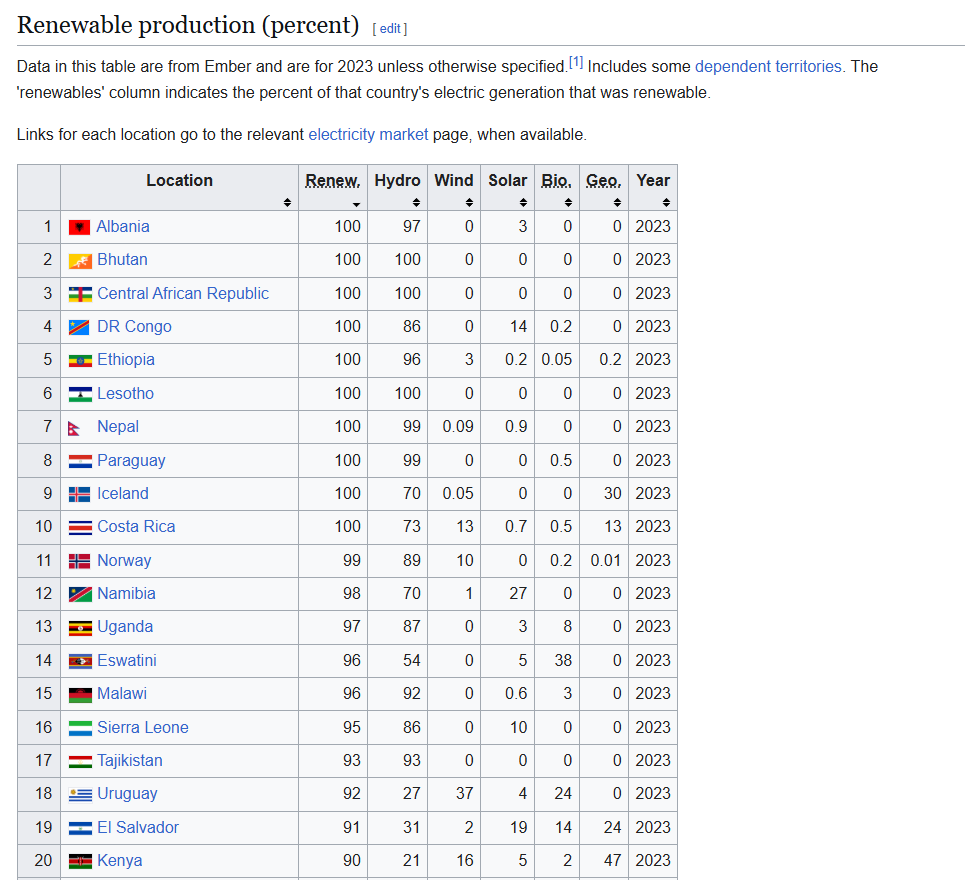
This is immediately obvious when we look at the list of countries that lead the world in % of power from renewable energy today - see any superpowers in there? It's lovely to be blessed with abundant hydropower or geothermal resources, but that hardly drives global change.
China, at around 36% renewables (and rising of course) both installs more than the rest of the world combined, and exports the technology to green the power sectors of developing nations globally. If we must have this conversation, then it should acknowledge absolute volume and international impact, where China is clearly dominant...
2. Erroneous Analysis and Data
OP's post says "Two-thirds of electricity in China is from thermal plants...that's coal".
This is incorrect on several accounts. First, "thermal" in the monthly press release of the National Bureau of Statistics includes coal, gas, and renewables like biomass. Coal is the lion's share, but no, it's not ALL coal. So that's already a problem.
Next, the NBS monthly datasets do not report full power generation (全口径) across the whole economy, only generators "at-scale" (规模以上) which excludes small wind and solar (like rooftop solar, which is half the solar).
Thus, it's impossible to calculate from this data series what percentage of power generation is coal without many assumptions. You must estimate, or wait for the quarterly data dumps or the annual statistics yearbook.
I'm not the first person to point this issue out. But OP has either ignored or dismissed everyone else who's pointed it out so far, so it must be repeated.
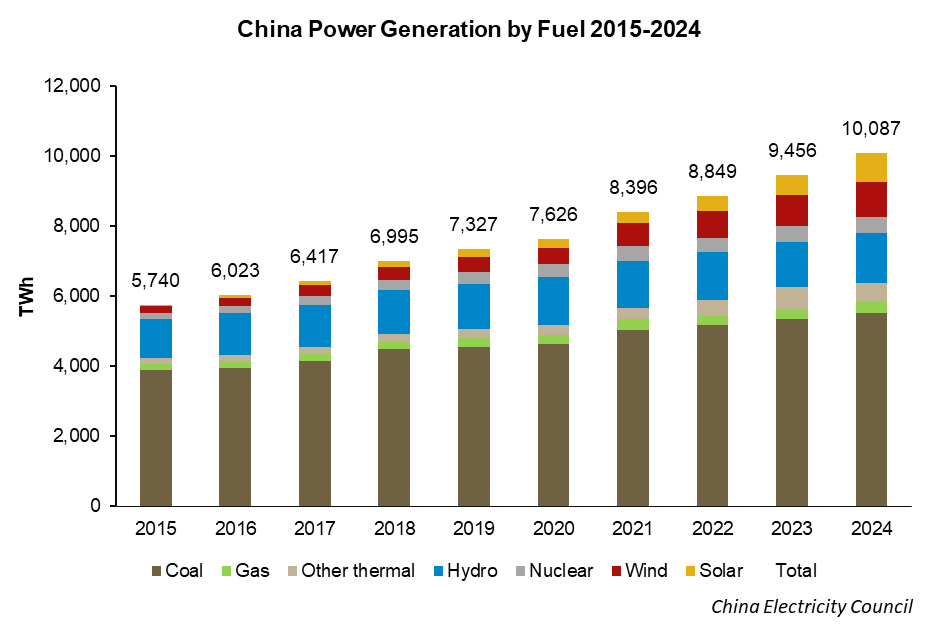
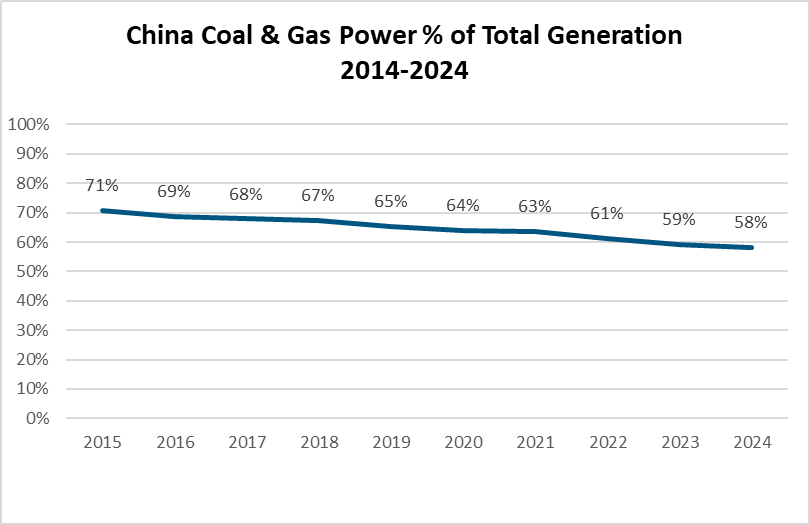
In the 2024 annual statistic yearbook published by China Electricity Council (CEC), coal comprised 54.8% of generation at the end of 2024, with gas-fired power adding another 2.6%. These numbers have been falling steadily for a decade and will fall again this year.
3. Flawed chart-making and chart premise
Another issue here is OP's odd chart choices, which undermine the credibility of his argument. As a purported professional with a finance background, these mechanical errors are baffling.
First, the minor chart and nomenclature gaffes:
"Electricity power generation" is redundant. Pick "electricity," "power," or "electric power."
"Electrification" means "% access to electricity" or "electricity's share of energy consumption". It's misused in the linked post.
Watt should be capitalized in units like kWh.
"billions of kWh" should convert to TWh for clarity.
The "total" data series adds nothing. Delete it or use it for labels and hide the line.
The color scheme is inexplicable (I admit this is subjective). Why blue for thermal? Red for hydro?
Now, the glaring chart issue:
Why cram 20 years of data into a stacked area chart to discuss trends emerging in the last 3-5? Could anyone see from OP's chart if thermal, solar, or wind is rising? Can you see any recent trends or inflection points? OP's chart obscures everything, while he makes sweeping statements without visuals to back those statements. You must use the right tools for the job. This is not a minor error.
OP’s chart
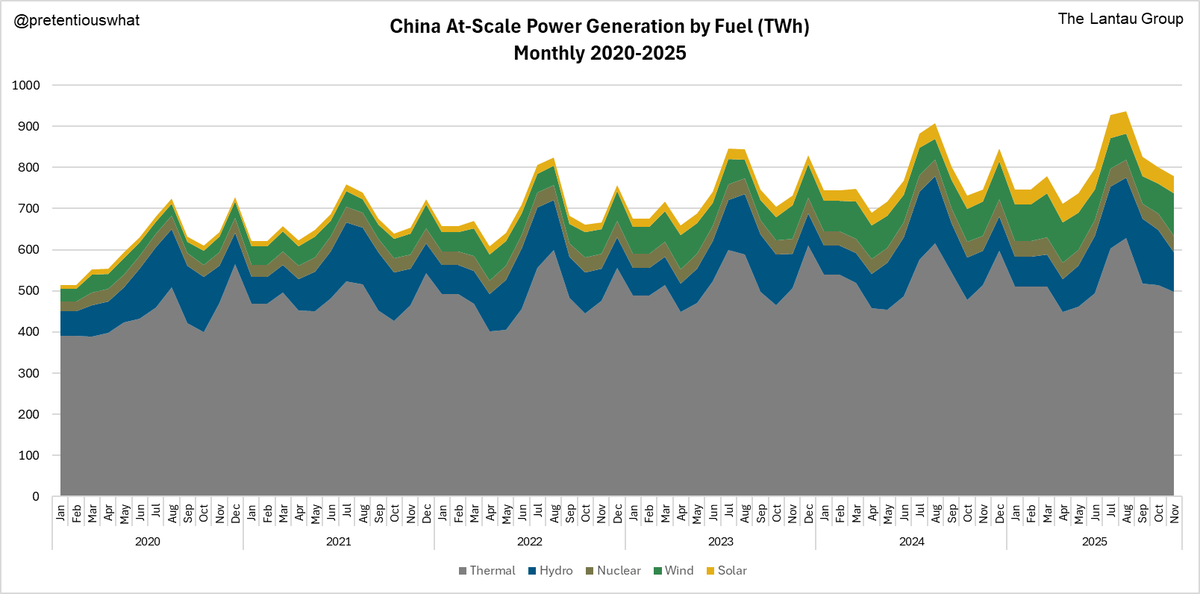
Let us try to do better, starting with this chart, using the same NBS monthly datasets, but looking only at the last 5 years. Now, we can start to see what looks like a flattening of thermal generation while other generation types grow. But to be honest, it's still tough to see...
Thus, it should be helpful to zoom in even more. Here's a look at generation by discrete fuel type (nuclear is excluded here, as it's the least interesting).
Now the trends should be a little easier to spot...(but please note the differing y-axes among charts).
What do we see? Looking at the charts above, a few things are clear:
Wind and solar are growing extremely rapidly (but the y-axis tells us they are still small overall).
Hydropower is very seasonal.
Thermal power is doing...something? Actually even in that chart above, it's still hard to tell if it's trending upwards, downwards, or flat. We're going to need a different chart for this — something that can show annual changes.
OP used seasonally adjusted QoQ data in the linked article, which is unnecessarily complex and still vulnerable to distortion. How about something much simpler, like Monthly YoY changes?
Ah, now we're getting somewhere. Thermal generation data over the last few years show considerable monthly volatility; some months spike well above the prior year's levels, while others dip sharply below. To gauge progress toward peaking coal consumption, we'll need to see the chart dwelling mostly in negative territory, indicating year-over-year declines, with minimal positive excursions.
And that's what we're starting to see! Over the past 18 months, thermal generation has hovered below the zero line about as often as above it. In other words, over 2025 China routinely used less thermal power in a given month than the year before.
Of course, the net impact hinges on timing: a drop during high-demand summer or winter months carries more weight than an uptick in low-demand shoulder seasons. But at least this year-on-year monthly view is a cleaner way to spot long-term trends in generation than a QoQ seasonal adjustment. Again, you must use the right tools for the job.
And what is the net effect of spending more time below the 0 line than above it? Net falling thermal generation...!
That's why recent NBS data show 2025 YTD (i.e., Jan-Nov) at-scale thermal generation is DOWN 0.7%, even though total at-scale power generation is up 2.4%.
For contrast, here are the monthly YoY trends for wind and solar generation....consistently 20-30% higher than the previous year...in almost every month.
Notice how much volatility there is in renewables though — especially from wind. Every year, there's always more generation capacity than there was in the same month the year before, and yet we sometimes see very weak — or even negative — year-on-year monthly growth from these variable resources.
In 2025, October was particularly poor for both solar and wind, despite the vastly higher capacity numbers versus October 2024. That poor wind and solar performance directly corresponds with the October spike in thermal generation in the charts above.
Another variable generator to worry about is hydropower. Hydropower isn't nearly as variable on a daily or weekly basis, but has seasonal variation, and can vary a lot annually based on rainfall.
Over the last 5 years, hydropower generation and thermal generation have been moderately negatively correlated (r = -0.575). As wind and solar capacity grow, this correlation will probably weaken. But for now, like with other renewables, if hydropower doesn't perform well, thermal is needed to fill the gap. This will continue to be a risk that can cause thermal generation to rise in certain months.
3) In summary
This year, China added enough low-carbon power to meet 100%+ of its 2025 incremental power demand, peaking thermal generation. We don't know yet if it will be a durable peak, but even if it ticks up again in 2026, it's bound to be very close. It happened because China has made it a top strategic priority to dedicate more capital and resources to build and transmit low-carbon power than the next 10 countries together.
Regardless of whether we look by month or by quarter, we see thermal generation flattening out. China hit the inflection point this year, where the trendline slips below zero. The share of thermal power has already been declining for years; now the absolute thermal generation volume will also begin declining.
There's just no strategic or tactical value in dismissing these facts — not that I can see at least.
4. In Conclusion
In this review, I’ve relied on public datasets and presented them as transparently as possible. No privileged information was used, only industry knowledge. As I’ve proudly written before: I’m an analyst, not an activist. My focus is the economics of Chinese electricity, not climate advocacy or sustainability consulting. That distinction matters: my role is to provide independent assessments, not satisfy interest groups. Our work primarily serves multinational clients, not Chinese firms, and certainly not any agenda about portraying China in a particular light.
I take issue with the narratives and dataset handling in the original piece because the seniority of its author should demand greater rigor. The emphasis on narrative-policing and framing debates around perceived mischaracterizations of China’s clean energy leadership misses the point entirely. China is already demonstrating the capacity to add green power equivalent to the annual consumption of entire countries. This is not only a significant contribution to the energy transition...it’s also good business. Where else could that trajectory lead?
Over the past decade, generalist commentary from overseas has repeatedly underestimated China’s disruptive potential - whether in EVs, batteries, solar PV, drones, telecom/5G, AI, or even rare earths. Each time, the signs were visible, yet dismissed, resulting in repeated unnecessary“surprise”moments. The same pattern is now unfolding in energy. China’s energy transition “surprise” has been building quietly for years; it is now beginning to accelerate visibly. Ignoring or downplaying this reality will not change a thing. Enditem
Thanks for reading Yuzhe He's newsletter! This post is public so feel free to share it.
Thanks for this. Couple this essay with an understanding of the planned development of China's energy production, and an entirely different picture becomes clear.
In the Manhattan Institute's "Energy Transition Delusion" study of a few years ago, they describe a process remarkably similar to China's plan for the energy transition, which simply stated, requires reliance on fossil fuels for the near future before reductions in fossil fuel use can be implemented and production shifted to nuclear and renewables. Even with nuclear and renewables, there will be periods where some reliance on fossil fuels will be necessary to provide power.
There is no such thing as green energy.