
Lu Feng on China's six trade surplus peaks, their reasons and implications
along with nine features of China's most recent trade surplus since 2021

Update - April 27: For the convenience of readers, several changes have been made in this update. Special thanks to Tom Hancock for his valuable suggestions:
The specific year has been identified instead of using the term "13th/14th Five-Year Plan" throughout the piece.
Long paragraphs have been broken down into smaller sections for better readability.
Necessary annotations have been added, which were missing in the first version. For instance: "Over 2021-24, external demand accounted for 0.77% of GDP growth, far higher than the 0.08% annual average during 2016-20. (This indicator measures the GDP growth rate under the assumption that the contributions of the other two components of aggregate demand, investment and consumption, to GDP growth are zero)."
Yuzhe
******
One of the foremost catalysts for the U.S. trade war with China is the mounting concern over China's escalating trade surplus in recent years. This issue is particularly evident since the 14th Five-Year Plan (2021-25), where China's trade surplus has reached "record-breaking levels."
Consequently, it is crucial to scrutinize the characteristics and implications of China's trade surplus since its reform and opening-up in 1978.
Professor Feng LU 卢锋 of Peking University's National School of Development has conducted an in-depth and systematic research into this subject.
Dr. Feng Lu earned his Ph.D. in Economics from the University of Leeds in 1994 and is currently an emeritus professor at the National School of Development at Peking University. His research spans China's open macroeconomy, covering topics such as exchange rates, external imbalances, capital return, food security, and agricultural development. Dr. Lu also contributes as an advisor or member of expert groups for numerous Chinese government bodies, including the Ministry of Finance and Ministry of Agriculture.

On April 7th, Professor Lu released a comprehensive research entitled "Countering U.S. Tariffs: Why a Dual Approach Is Necessary—The Context of the Extraordinary Growth of Foreign Trade Surplus During the 14th Five-Year Plan (2021-25)." 反制美方关税战,为什么要两招并用——十四五时期外贸顺差超常增长背景角度. This article, according to the intro, synthesizes Dr. Lu's various reports and internal discussions on the topic.
It is divided into five sections:
A concise analysis of aspects of Trump's new policy (Trump 2.0);
A detailed critique of the underlying logic and inherent flaws of the U.S. tariff war, framed through the "A User’s Guide to Restructuring the Global Trading System";
A comprehensive summary of the sharp rise in China's trade surplus in recent years, featuring nine critical characteristics;
A deep dive into the six primary causes behind this surge in trade surplus, with particular emphasis on the insufficient domestic demand, viewed through both international and domestic lenses;
A discussion of China's policy options in responding to the tariff war, coupled with its efforts to pursue economic rebalancing, underscoring the proactive approach of rebalancing as the most effective strategy against U.S. tariffs.
In today's newsletter, I have translated sections three and four of this article, which meticulously outline the six key peaks of China's trade surplus since 1978, along with their subsequent impacts and underlying causes. Additionally, it has distilled the nine features of the recent wave of surplus growth, which has taken center stage since 2021.
Given the length of the article, some excerpts have been selected by your host as follows:
美欧顺差占比从“十三五”占大约的大约九成,减少到“十四五”前四年的年均76%,显示我国对美欧主要发达经济体顺差依赖度显著减少,但是美欧市场仍是我国顺差实现的基本对象。
The share of the trade surplus with the US and EU dropped from about 90% in the 13th Five-Year Plan (2016-20) to 76% on average in 2021-24, signaling a significant reduction in China's dependence on these major developed economies for its surplus. However, the US and EU markets remain key destinations for China's surplus.
我国经济增长对外需依赖度大幅上升。受疫情冲击等多方面因素影响,2020年以来我国平均经济增速回落到5%以下,同时经济增长对外需依赖度大幅增长。
China's reliance on external demand for economic growth has increased significantly in recent years. Since the pandemic, and due to various other factors, China's average economic growth rate has fallen below 5%, while its dependence on external demand has risen sharply.
2024年发展中国家对我发起贸易调查117起,占我遭遇贸易争端总数的近六成。这些情况与公众一般认为针对我国贸易争端主要源于发达国家的传统认知不完全一致,显示我国出口顺差不仅在中高端或新兴行业加速扩大,在相对传统部门和较低端行业也在快速增加,传导为我国外部经贸关系较普遍趋于紧张的压力。
in 2024, developing countries initiated 117 trade investigations against China, accounting for nearly 60% of the total trade disputes China faced. This challenges the common belief that most trade disputes with China stem from developed economies, and reveals that China's export surplus is expanding not only in high-end and emerging sectors, but also rapidly increasing in more traditional and lower-end industries. This shift reflects broader pressures in China's external trade relations, where tensions are becoming more widespread.
经济较后进省区的地市级以至县级的产业政策,则更多涉及产业结构中较为中低端部分,有可能与低中收入外国产业形成竞争关系。因而,上述贸易争端领域特殊现象,或与我国要素价格包括国民收入分配存在问题有关。
Industrial policies in less developed provinces and counties often focus on mid- and low-end sectors, potentially creating competition with lower- and middle-income foreign industries. Therefore, the special phenomenon of trade disputes could be linked to underlying imbalances in China’s factor prices and income distribution.
应当指出,出现这种资源配置不尽合理情况,责任不在企业,更不在工人,因为市场主体基于自身机会成本决策并没错……折射我国开放型经济内外不平衡的深层矛盾因素。
It is important to note that the responsibility for this misallocation of resources does not lie with the company or its workers, as market participants are making decisions based on their own opportunity costs… reflecting the deeper contradictions within China's open economy—imbalances both internally and externally.
可推测我国公共部门掌控资源占GDP比例或在45%上下……然而用于支持居民收入与消费的投入规模则相对较小和偏少。当供给能力得到持续大幅拓展提升后,与内需不足特别消费增长较慢匹配不协调,供强需弱矛盾对贸易平衡方式产生影响。
It is estimated that the proportion of public sector-controlled resources as a share of GDP is around 45%… However, the relatively small and insufficient allocation of resources to support household income and consumption has led to a mismatch between the significant expansion of supply capacity and weak domestic demand, especially slow consumption growth. This imbalance between strong supply and weak demand has impacted the trade balance.
Below is the full translation.
III. Nine features of China's external trade surplus growth during the 14th Five‑Year Plan Period (2021-25)
An examination of China's goods‑trade surplus as a share of exports over the reform and opening up era (since 1978) reveals six distinct peaks within an overall upward trajectory. These peaks illustrate the cyclical dynamics of China's open‑economy development and evolving trade‑balance conditions.
The first cyclical peak occurred in the early reform period, when China's macroeconomic restructuring led to temporary demand contraction, while institutional reforms simultaneously unleashed supply-side growth in basic necessities. This combination became the driving force behind the trade surplus surge at that time.
The second and third peaks occurred around 1990 and the late 1990s respectively. Both periods saw China's domestic demand weaken significantly due to different factors – including impacts from the Asian Financial Crisis – leading to temporary oversupply in the domestic economy that drove trade surplus expansion.
The fourth peak, in the early 2000s, was especially notable. As China's manufacturing productivity surged and export competitiveness skyrocketed, domestic structural reforms and policy adjustments failed to keep pace. This mismatch between soaring supply capacity and lagging domestic demand growth triggered an explosive rise in trade surpluses.
The fifth peak occurred around 2013-2015 when China implemented supply-side structural reforms and had to deal with a slowdown in economic growth, make painful structural adjustments, and absorb the effects of previous economic stimulus policies all at once. As domestic capacity cuts collided with slowing demand, trade surpluses ballooned.
The most recent peak has occurred in the past few years, within the 14th Five‑Year Plan period (2021-25). A complex mix of domestic and international factors—chief among them an excess of supply over demand domestically—has driven the trade surplus to record levels.
What follows is a concise overview of nine defining features of this latest phase of surplus growth and its broader implications.
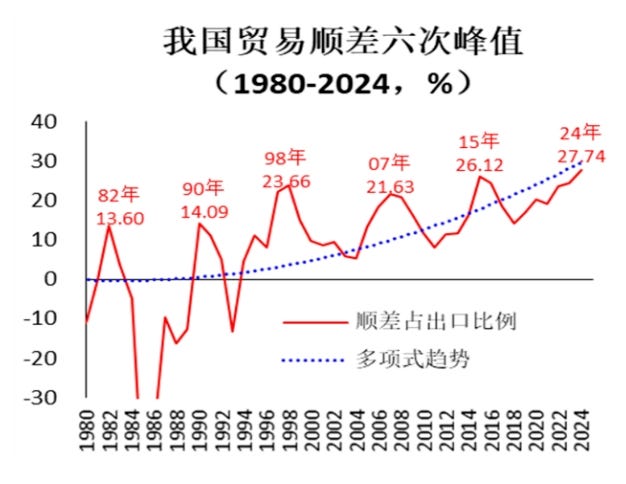
Title: Six Peak Values of China's Trade Surplus
Red solid line: Trade surplus as a percentage of exports
Blue dashed line: Polynomial trend
Feature I: China's current‑account surplus reached record highs, yet as a share of GDP it remains broadly normal.
In macroeconomic analysis, the current account balance is a key gauge of external equilibrium. Over 2021–24, China's average annual surplus hit about $368 billion—2.4 times the roughly $151 billion recorded during 2016-20 and more than 20% above the 11th Five‑Year Plan (2006-10) peak of $297 billion.
However, thanks to rapid GDP growth, that surplus amounted to just 2.02% of GDP on average between 2021-24. Although this marks a clear increase from the 1.16% seen during 2016-20, it remains far below the 7.24% peak in 2006-10, indicating an overall balanced external position.
Moreover, the IMF's External Sector Reports consistently judge China's external balance to be "broadly in line" with its medium‑term economic fundamentals.
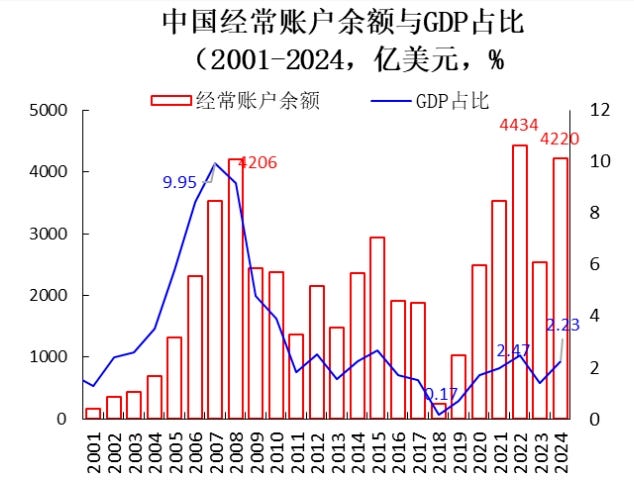
Title: China's Current Account Balance and Its Share of GDP (2001–2024, 100 million USD; %)
Red bars: Current account balance
Blue line: Share of GDP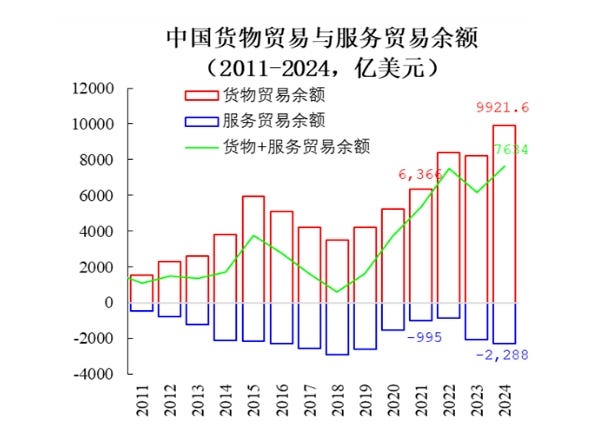
Chart Title: China’s Goods and Services Trade Balances (2011–2024, 100 million USD)
Red bars: Goods trade balance
Blue bars: Services trade balance
Green line: Combined goods + services trade balance
Feature II: Significant increase in China's goods trade surplus, in absolute terms and relative to GDP.
In recent years, China's merchandise trade surplus has surged dramatically, reaching $992.1 billion in 2024. Over 2021-24, the average annual surplus stood at $822.2 billion, an 84.7% increase compared to the $445.1 billion average during the 2016-20.
Meanwhile, China's services trade has remained in deficit, with an average annual deficit of $155 billion during 2021-24, a 34.8% reduction from the $237.7 billion deficit during 2016-20.
As a result, the total trade surplus rose from $207.4 billion in 2016-20 to an average of $667.2 billion over 2021-24, more than doubling. This increase brought the total trade surplus to 3.67% of GDP, well above the 1.34% recorded during 2016-20.
Feature III: Within merchandise trade, the surplus in manufactured goods has grown much faster than the deficit in primary goods.
In 2024, the manufactured goods surplus reached $1.99 trillion, with an average annual surplus of $1.74 trillion over 2021-24. This marks an 80.3% increase compared to the $965 billion annual average during 2016-20.
At the same time, the primary goods trade deficit also grew sharply, reaching $898.9 billion in 2024, with an average annual deficit of $889.7 billion over 2021-24.
This represents a 77.5% increase from the $501.2 billion annual average during 2016-20.
The absolute growth in the primary goods deficit is approximately half of the manufactured goods surplus, and the growth rate of the primary goods deficit is slightly smaller than that of the manufactured goods surplus.
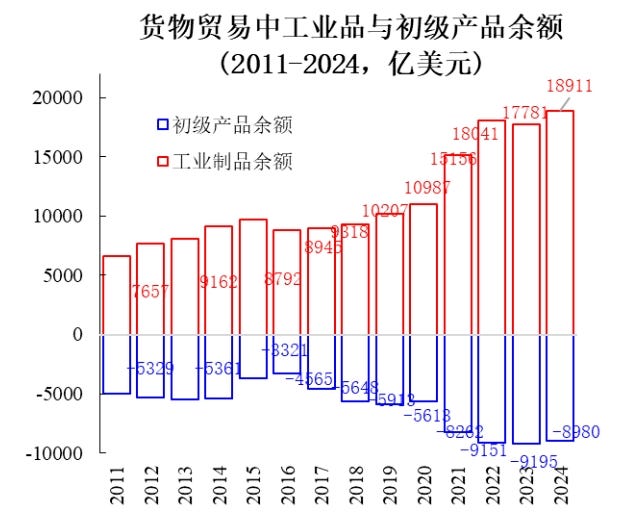
Title: Balance of Industrial Goods and Primary Products in Merchandise Trade (2011–2024, 100 million USD)
Blue bars: Balance of primary products
Red bars: Balance of industrial products
Feature IV: Within manufactured goods, the surplus of high-tech products has accelerated significantly, while traditional industries, including mid- and low-end sectors, have also seen fast growth.
From 2021-24, the average annual surplus in high-tech products reached $785 billion, an increase of $442.7 billion, or 129%, from the $342.3 billion annual average during 2016-20.
Sectors such as electric vehicles, lithium batteries, and solar cells—often referred to as the "new trio" industries—saw their combined exports rise from less than $15 billion in 2018 to $131 billion in 2024, generating a surplus increase of over $100 billion.
Similarly, the chemical raw materials sector shifted from an average annual deficit of about $50 billion during 2016-20 to a surplus of $25.8 billion over 2021-24.
At the same time, traditional manufactured goods, including mid- and low-end sectors, also saw a rapid increase in surplus. The average annual surplus for these goods over 2021-24 was $962.2 billion, an increase of $339.5 billion, or 54.5%, compared to the $622.7 billion annual average during 2016-20.
The trade surplus in manufactured goods shows a "sharp rise in high-end products and rapid growth in mid- and low-end products."
This phenomenon may be linked to the various industrial policies implemented by governments at different levels, as well as to the strategic limitations imposed on certain traditional industries facing exit pressures.
Feature V: The geographical distribution of China's trade surplus has become more diversified in recent years, although the US and EU continue to account for the largest share.
China's merchandise trade surplus from 2021-24 compared to the previous five years shows the following trends: the surplus with ASEAN grew 1.2 times, the surplus with the five Central Asian countries increased more than threefold, the EU increased by 1.3 times, and the US saw a smaller increase of just 30%.
As a result, the share of US and EU in China's trade surplus dropped from about 90% in 2016-20 to 76% on average in 2021-24, signaling a significant reduction in China's dependence on these major developed economies for its surplus. However, the US and EU markets remain key destinations for China's surplus. Additionally, data suggests that China has shifted part of its surplus with the US through outward foreign direct investment (OFDI) and re-export trade with other countries.
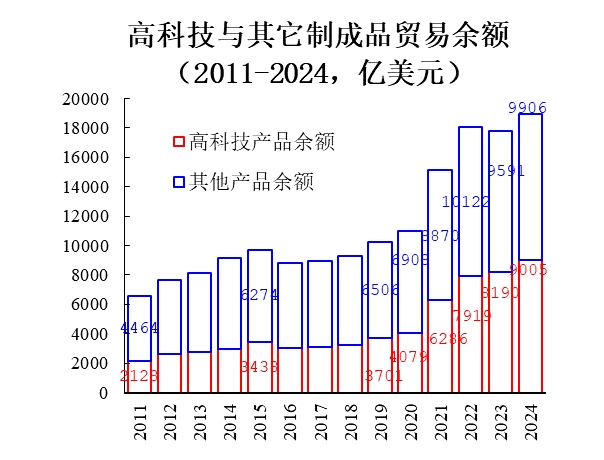
Title: Trade Balance of High-Tech and Other Manufactured Products
Red bar: High-tech products balance
Blue bar: Other products balance
Feature VI: China's share of total global trade surpluses has risen substantially in recent years.
The proportion of global merchandise trade surplus held by China has surged from 17.5% in 2018 to 36.6% in 2024.
Moreover, China's share of the global manufactured goods trade surplus has increased from 47.8% in 2020 to 64.8% last year.
The high share of structural trade surpluses globally highlights China's strong external competitiveness in an open economy. However, given the dramatic changes in the global economic and trade environment, China faces significant risks if overall global demand contracts.
Feature VII: China's reliance on external demand for economic growth has increased significantly in recent years. Since the pandemic, and due to various other factors, China's average economic growth rate has fallen below 5%, and its dependence on external demand has risen sharply.
Over 2021-24, external demand accounted for 0.77% of GDP growth, far higher than the 0.08% annual average during 2016-20. (This indicator measures the GDP growth rate under the assumption that the contributions of other two components of aggregate demand, investment and consumption, to GDP growth are zero).
This figure has only been higher during the 2005–08 period of significant economic imbalance, when it was 1.07%.
Looking at the contribution of external demand to GDP growth, the average for 2021-24 was 13.17%, far surpassing the 5.24% during 2016-20 and even exceeding the 8.56% peak during 2005–2008. (This indicator measures the contribution of external demand to the total GDP growth rate - for example, if the GDP growth rate is 5% and the contribution of external demand is 10%, it means that 10% of that 5% is contributed by external demand growth).
It's important to note that after the rapid expansion of surpluses in the early 2000s, the contribution of external demand to China's economic growth sharply contracted due to the external financial crisis. In 2009 and 2010, this contribution fell to -42.2% and -10.6%, respectively, with the percentage points contributing to GDP growth at -3.97% and -1.12%.
The historical experience points to an urgent issue: In the context of the extreme trade war launched by the US and a shifting global economic environment, how to prevent a negative impact on China's economic growth from the abnormal expansion of trade surpluses has become a key concern that requires proactive measures.
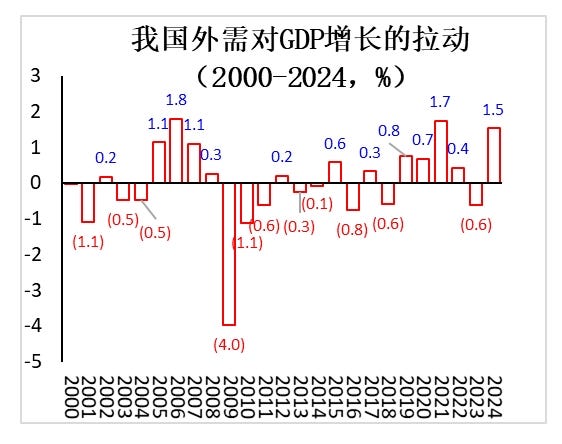
Title: Contribution of External Demand to China’s GDP Growth (2000–2024, %)Feature VIII: Rise of trade protectionism in 2023, with the Trump administration taking tariff policies to extremes.
In 2021-2022, during the pandemic, the Western countries took a relatively restrained approach to trade balance issues. However, after the second half of 2023, they shifted to unilateral tariffs and other measures to suppress China's exports of the "new trio" industries. In May 2024, the US announced a 100% tariff on Chinese electric vehicles. On July 4 of the same year, the EU imposed temporary tariffs on Chinese electric vehicles over alleged subsidies, and on August 26, Canada followed suit, announcing a 100% tariff on all electric vehicles imported from China. As noted earlier, under the Trump administration, tariffs became a frequent tool, with the recent introduction of so-called "reciprocal tariffs" taking protectionist measures to unprecedented extremes.
Feature VIIII: Record high number of trade investigations against China at the WTO, reflecting worsening external trade environment.
In 2021-2022, China faced a relatively low number of trade investigations at the WTO, but this quickly reversed in the following years. Notably, in 2024, the number of investigations reached a record 198, a 59.7% increase from the previous peak of 124 in 2009. Excluding cases involving China, the number of global WTO disputes also surged in the past two years, reaching 237 in 2024—though this remains the fifth highest on record and is still 30.4% below the historical peak of 309.
In fact, China accounted for 111 of the 206 global increases in trade disputes in 2024, or 53.4% of the total rise. This unprecedented surge in trade investigations reflects both the broader global tensions in economic and trade relations and, to some extent, issues unique to China.
Moreover, the countries initiating trade investigations against China are not limited to advanced economies like the US and EU; a significant number of developing countries have also been involved.
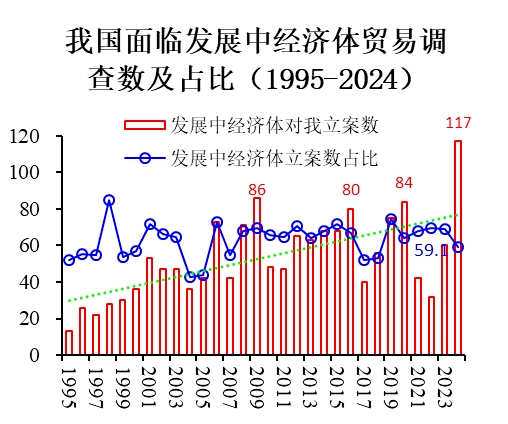
Title: Trade Investigations Faced by China from Developing Economies: Number and Share (1995–2024)
Red box: Number of investigations initiated by developing economies against China
Blue line: Share of investigations initiated by developing economies (%)
The data above shows that in 2024, developing countries initiated 117 trade investigations against China, accounting for nearly 60% of the total trade disputes China faced. This challenges the common belief that most trade disputes with China stem from developed economies, and reveals that China's export surplus is expanding not only in high-end and emerging sectors, but also rapidly increasing in more traditional and lower-end industries.
This shift reflects broader pressures in China's external trade relations, where tensions are becoming more widespread.
It is worth considering why many developing countries, whose economies are at a different level of development than China's, would view China's exports as direct competition for their domestic industries, leading them to initiate multiple trade investigations at the WTO. The reasons may be complex, including the possibility of excessive protectionism towards domestic industries.
However, in China's case, this could also be related to the multi-layered industrial policy environment: national policies focus on cutting-edge high-tech breakthroughs, coastal, more developed provinces and cities also target advanced sectors, and even cities in developed coastal areas often target high-end industries as policy objectives.
In contrast, industrial policies in less developed provinces and counties often focus on mid- and low-end sectors, potentially creating competition with lower- and middle-income foreign industries. Therefore, the special phenomenon of trade disputes could be linked to underlying imbalances in China's factor prices and income distribution.
Building on this understanding, I tracked down a company in an economically underdeveloped county in an eastern province that produces a product involved in these trade investigations. This company began producing the product in 2006, when it was considered a relatively advanced industry in the region. However, after nearly 20 years, the technology and processes have not significantly upgraded.
In an economic environment where structural transformation is ongoing and factor prices such as labor wages are steadily rising, production processes that have existed for nearly 20 years should have undergone transformation or orderly exit.
Yet, this company is still operating at half capacity, supplying both domestic and export markets, and continues to receive policy support from the local government. It is important to note that the responsibility for this misallocation of resources does not lie with the company or its workers, as market participants are making decisions based on their own opportunity costs.
The lack of exit is due to a lack of better transformation opportunities and the absence of external pressure from rising factor prices, reflecting the deeper contradictions within China's open economy—imbalances both internally and externally.
IV. Six Key Domestic and External Drivers of Recent Trade‑Surplus Growth
In recent years, the global economy has faced multiple shocks and rare fluctuations, leading to a sharp increase in China's trade surplus and structural external imbalances. There are several internal and external factors behind this trend. A preliminary analysis suggests at least six key reasons that have influenced external trade balance, with domestic supply outpacing demand or strong supply meeting weak demand being a particularly significant explanation.
Below, we will examine each of these factors individually and then discuss their overall impact and interrelated mechanisms.
Reason I: The impact of different crisis-response policies between China and other countries during the pandemic. In response to the sudden shock of the COVID-19 pandemic, China and major developed economies adopted different approaches based on their unique national conditions. In terms of economic response, China's crisis‑relief stimulus resources were primarily directed at subsidizing supply‑side sectors, particularly to support the resumption and expansion of production. Direct subsidies to ordinary households were relatively limited, resulting in rapid production growth but relatively low growth in consumer spending.
In contrast, the US and EU provided large-scale income subsidies to households, which stimulated faster consumption growth. However, they lacked sufficient momentum for business recovery and expansion. These complementary approaches between China and the West were transmitted through trade channels, contributing to China's growing trade surplus. This factor was particularly significant between 2020 and 2022, during which China's surplus with the US reached record levels, and its surplus with the EU doubled.
Reason II: Closely related to the first point, the excessive stimulus policies implemented by the US and EU during the pandemic led to severe inflation. In an effort to control inflation, they raised interest rates, which in turn strengthened their currencies, eroding their external trade competitiveness and further expanding China's trade surplus with them.
Amid the rapid rise of emerging economies, the US and EU were already facing declining productivity growth in tradable sectors, such as manufacturing, relative to emerging markets, which weakened their trade competitiveness.
Driven by a long‑standing reliance on stimulus measures, they implemented unprecedented large‑scale stimulus policies directly aimed at households. This led to the highest inflation in 40 years in the Western economies in 2021, forcing them to raise interest rates sharply as an emergency response. The inflation and interest rate hikes drove up the real exchange rates of the US and EU, resulting in a sharp increase in their trade deficits. This, in turn, contributed to the expansion of China's trade surplus.
Reason III: Breakthroughs in manufacturing upgrades in recent years have created new competitive advantages in high-tech and emerging sectors. China's trade surplus has been boosted through export growth and import substitution.
While external and unique environmental factors cannot be ignored, to understand the extraordinary growth in trade surpluses in major economies and the structural imbalances, it is essential to focus on domestic economic growth and supply-demand dynamics. There are two key factors to consider:
First, China's tradable sector has made significant technological progress and breakthroughs in recent years, which have greatly improved supply-side capacity and external competitiveness. These changes are positive achievements and, in some areas, contribute to the fulfillment of the supply-side goals in the "dual circulation" strategy.
Second, domestic demand, particularly weak consumption growth, has not seen substantial improvement. On the contrary, it has continued to worsen for various reasons. The mismatch between the supply-side growth and weak demand has played a significant role in the rapid expansion of the trade surplus and the structural external imbalances.
Since the reform and opening up, China's manufacturing sector has undergone three phases of transformation and upgrading.
The first phase, from the 1980s to the early 1990s, saw the restructuring of state-owned industries and rapid development of light manufacturing, consumption goods, and processing industries in an open market environment.
The second phase, from the mid-1990s to around 2010, accelerated industrialization and urbanization, driving the rapid expansion of heavy industry. The extension of industrial chains propelled many of China's manufacturing sectors to global scale, with significant increases in capital and technology intensity.
The third phase, in recent years, has seen mainstream manufacturing capabilities rise to the mid-to-high end, with some sectors becoming globally competitive, and individual industries leading the world in innovation. Sectors such as advanced shipbuilding, rail transit, petrochemical raw materials, large aircraft, medical devices, chip fabrication, and industrial robots see progress at different level.
Two sectors stand out in this process. First, the substantial increase in chemical raw materials production has turned a trade deficit into a surplus. Second, the "new trio" industries—electric vehicles, lithium batteries, and solar panels—have exceeded expectations, with significant growth in both domestic production and exports, contributing to a surge in trade surpluses.
Reason IV, China's property‑market correction has temporarily held back domestic demand. Since the "three red lines*" rules kicked in during 2020, the sector has faced its steepest pullback—sales, financing, investment, and prices all tumbled more sharply than at any point since the marketization of the industry at the end of the last century.
*Three red lines refer to:
Liabilities should not exceed 70 percent of assets (excluding advance proceeds from projects sold on contract)
Net debt should not be greater than 100 percent equity.
Money reserves must be at least 100 percent of short term debt.
The real estate sector is one of the industries with significant macroeconomic impact. While the new policy has successfully addressed the long-standing imbalances caused by years of excessive expansion in the industry, it has also imposed constraints on fixed investments and household consumption through various channels.
Additionally, due to China's unique land-financing system, the deep adjustment in real estate has led to a significant contraction in local governments' land-sale revenues, which, in turn, has reduced local government spending, further dragging down domestic investment and consumption.
Reason V: Weak final consumption as a deep-rooted driver of the trade surplus. Weak consumption has been a persistent concern in macroeconomic analysis since the late 20th century. Although the share of household consumption in GDP rebounded significantly in the second decade of this century, it has recently declined again, making the issue even more challenging.
While both consumption and investment are fundamental components of domestic demand in macroeconomic analysis, they play different roles in maintaining the supply-demand balance.
Fixed investment represents demand during the investment phase, but once completed, it transforms into fixed assets, becoming new production capacity on the supply side.
To maintain a dynamic balance between supply and demand, additional demand must match the increased capacity.
In contrast, consumption is ultimate demand, often referred to as "final consumption," and plays a unique role in maintaining overall supply-demand balance. If consumption demand remains weak, expanding investment as a transitional form of demand, though important for balancing supply and demand, fails to address the root cause. Moreover, in an open economy, it results in a larger expansion of the trade surplus.
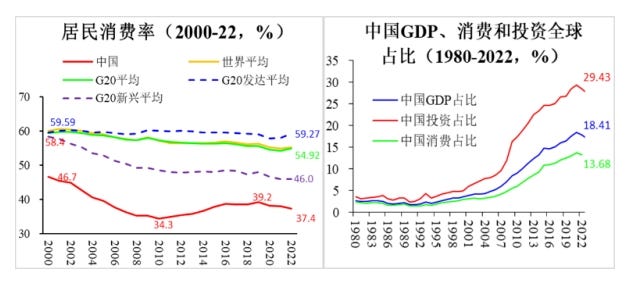
Left Chart Title: Household Consumption Rate (2000–2022, %)
Red solid line: China
Green solid line: G20 average
Yellow solid line: World average

Right Chart Title: China’s Share of Global GDP, Consumption, and Investment (1980-2022, %)
Blue: GDP
Red: Investment
Green: Consumption
Numerous studies by scholars and policymakers have analyzed the reasons behind weak consumption in China in recent years, focusing on factors such as the impact of the pandemic and its scarring effects, delays in counter-cyclical fiscal adjustments, and the strong regulatory effects on the real estate sector.
I believe that, in the long run, the allocation of large public resources primarily towards enhancing supply capacity, with relatively low investment in supporting household income and consumption, has also contributed to this issue.
Based on the broad definition of fiscal revenue, including profits from state-owned enterprises and public sector depreciation, it is estimated that the proportion of public sector-controlled resources as a share of GDP is around 45%.
The long-term characteristic of China's public resource allocation is that most resources are directed towards investments that promote supply capacity development. This has played an important role in boosting productivity and technological advancement.
However, the relatively small and insufficient allocation of resources to support household income and consumption has led to a mismatch between the significant expansion of supply capacity and weak domestic demand, especially slow consumption growth. This imbalance between strong supply and weak demand has impacted the trade balance.
Reason VI: Weak inflation and significant depreciation of the domestic currency push the trade surplus higher. From the perspective of open economic growth patterns, during a phase of rapid productivity catch-up, a country's real exchange rate tends to appreciate gradually. This supports the transformation of the domestic economy while maintaining overall external balance and promoting faster increases in per capita income. This growth logic, known as the Balassa-Samuelson effect, is well-documented in international comparisons and was evident in China in the early 2000s when the RMB continuously appreciated amidst high growth.
In recent years, despite facing multiple shocks, China's economy has maintained a relatively strong nominal effective exchange rate, demonstrating its strong competitiveness and resilience. However, due to the supply-demand imbalance and generally low inflation, combined with high inflation abroad, the real exchange rate of the RMB has significantly depreciated. Over the past year, the real exchange rate index has fallen back to 2013 levels, depreciating approximately 12.5% from the 2016 peak.
In the context of rapid industrial technology catch-up and productivity growth, the Balassa-Samuelson effect logically requires the real exchange rate to appreciate to maintain dynamic external balance. However, under the current unique conditions, the significant depreciation of the RMB has created a "reverse Balassa-Samuelson effect," which, in turn, adjusts external competitiveness and contributes to the expansion of the trade surplus.
It is important to note that the six international and domestic factors influencing China's trade surplus growth in recent years are not parallel or independent. Instead, they interact and overlap.
For example, the impact of the pandemic and the real estate market adjustment have affected domestic consumption growth through different channels. The trend of the RMB's real exchange rate is also influenced by a broad range of domestic and international macroeconomic and policy factors.
Overall, the significant growth of China's trade surplus and structural imbalances during 2021-25 should not be viewed as a short-term macroeconomic phenomenon solely driven by the depreciation of the domestic currency. Rather, it reflects the projection of the emerging economy’s supply-demand imbalance—specifically, the "strong supply and weak demand" contradiction—into external economic relations under the combined pressures of the pandemic and external inflation. This highlights the need for a coordinated approach, implementing policies to expand domestic demand, increase income, and promote consumption as a way to adjust the situation.
Data gold mine ! Very forthright !